

Purpose
Compare supplier performance, identify stock or delivery issues, and decide what to investigate next.
Before you start
You need access to Analytics, and Supply must be available for the selected webshop. Supplier-level results depend on the supplier history available for that webshop. Check the selected supplier, period, metric and unit before interpreting a result.
Steps: open Supply and check the supplier
- Select the webshop you want to review.
- Open Analytics from the main navigation.
- Select Supply from the report menu.
- Wait for the report to finish loading.
- Check the supplier selector above the headline cards and select the supplier you want to review.
Read the headline cards
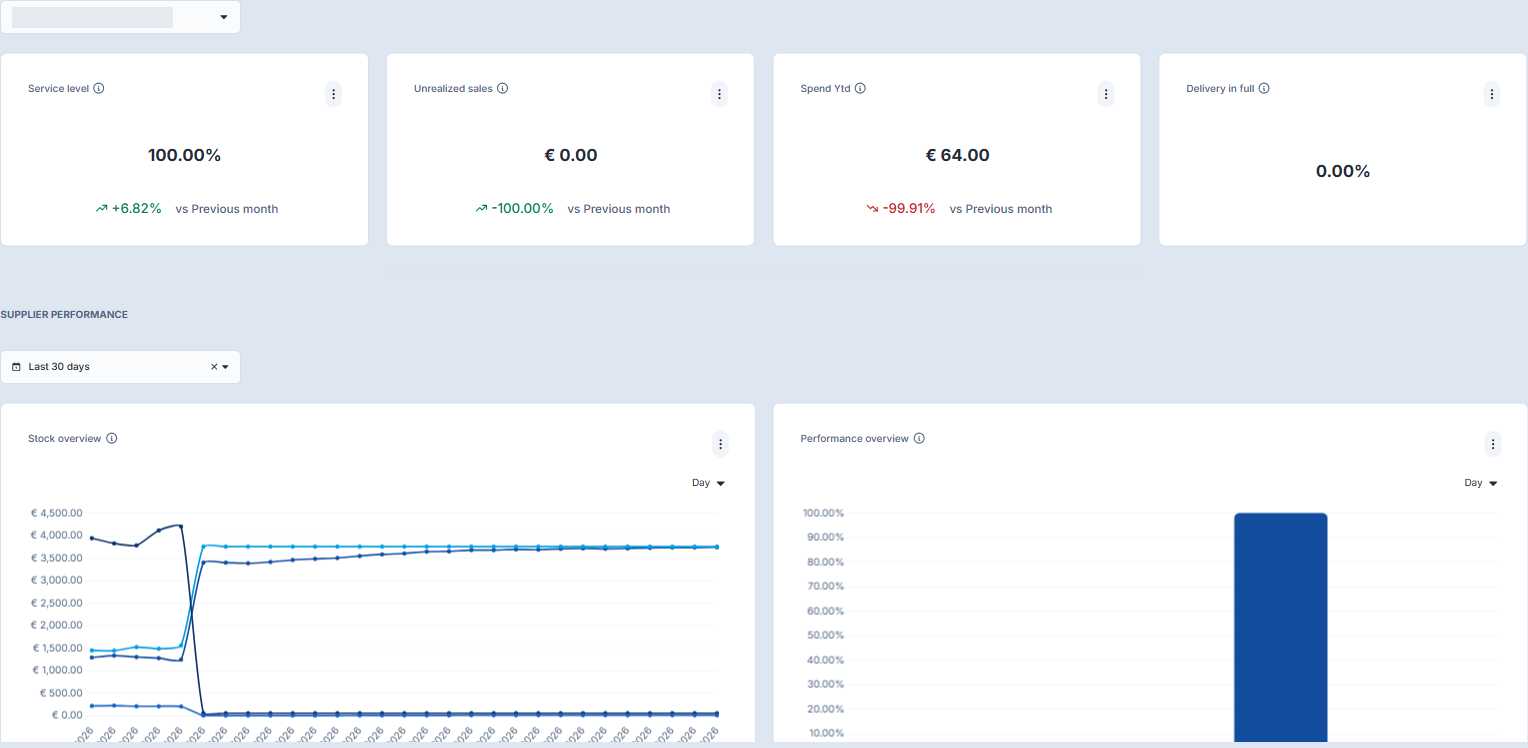
The example shows four cards:
- Service level: a headline service-level percentage.
- Unrealized sales: an unrealized-sales value, displayed in currency.
- Spend Ytd: spend year to date (YTD).
- Delivery in full: a headline percentage for delivery completeness.
Read any comparison label beneath the value. Three cards in the example show vs Previous month; Delivery in full does not show a comparison in this example. Check this separately from the chart period. Do not assume that changing chart dates also changes the cards' comparison period. A colour or arrow alone does not explain why a result changed.
Review Supplier Performance
- Find Supplier Performance and check its period selector, such as Last 30 days.
- Check the grouping control on each chart, such as Day. Grouping is the time interval used to display the results.
- Read the chart title, legend and unit before comparing series.
Which stock measures need a closer look? Use Stock overview to review inventory value, inventory value on order, deadstock value and overstock value. These measures describe different stock situations; a large value is a starting point for investigation, not proof of a cause. See Dead stock for more context.
How do delivery and ordering results compare? Use Performance overview to review the available on-time, in-full, order-count, overdue-order and advice-related measures. Check each measure's unit; a percentage and an order count are not interchangeable. Use the definitions below before drawing conclusions.
Compare trends in Supplier Metrics
- Find Supplier Metrics and choose the period in that section.
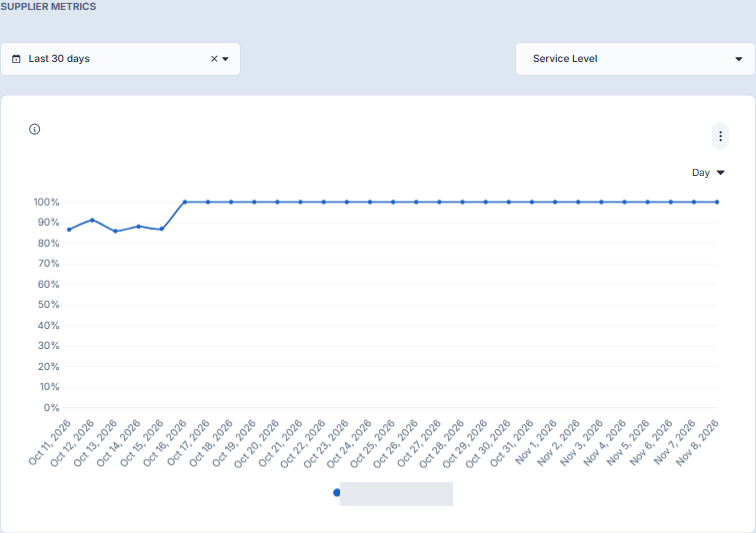
- Check the measure selected above each chart. Available measures include Service Level and Unrealized Sales Value.
- Check each chart's grouping, axis unit and supplier legend.
- Review how the selected measure changes over time. Compare measures only after checking their units and periods.
The illustration below shows the Service Level chart only. If a chart's unit does not match the selected measure, do not interpret it as that measure; follow the troubleshooting guidance below.
Read the Suppliers table
Use Suppliers to compare the visible supplier-level measures and decide where to investigate further.
- Check the supplier name for the row you are reading. The supplier identifier is a reference, not a performance measure.
- Review delivery completeness and timeliness separately; the example displays Delivery in Full and Delivery on Time as percentages.
- Compare Deadstock Value, Inventory Value and Inventory Value on Order with their distinct meanings in mind. The table also includes category-specific inventory columns; see ABC categories and ABC/XYZ classification settings.
- Check the column heading and unit rather than assuming every value is a total. The example's value cells do not display currency symbols.
- Scroll within the table to inspect additional rows; the table has its own scrollbar, separate from the page.
The cropped illustration shows column headings only, not a complete column inventory or supplier records.

Fields
Understand stock, delivery and spending measures
- Service Level is the average supplier service-level percentage.
- Proposed On Time and Proposed In Full are averages from proposed delivery expectations. Distinguish these from Delivery On Time and Delivery In Full, which are averages from recorded delivery results.
- Spend YTD and Unrealized Sales Value are summed currency values.
- Inventory Value, Inventory Value on Order, Deadstock Value, Overstock Value, Yearly Revenue and Spend Past Year are average supplier-level currency values.
- Orders Placed Past Year and Overdue Orders are average counts in the supplier-metrics data.
Understand Percentage Placed from Advice
Percentage Placed from Advice counts orders, not units or purchase value. An order linked to an Optiply order moment does not prove that every advised quantity was followed.
The calculation is orders linked to an Optiply order moment ÷ all qualifying purchase orders × 100, using the last 365 days. Each order counts once; units, order lines and purchase value do not weight the percentage. Supplier results use that supplier's order counts. The webshop total uses pooled order counts, not the average of supplier percentages.
Expected result
You can identify the selected supplier and relevant controls, compare stock and delivery measures, and find suppliers that need operational review. Check the controls in each section; do not assume every card, chart and table uses the same period or settings.
Limitations: data refresh and interpretation
Supply uses up to 730 days of supplier-metrics history and refreshes daily. It excludes deleted source rows. A recent delivery or supplier change may therefore take time to appear. The history available to the report does not change the last-365-days definition of Percentage Placed from Advice.
Viewing and filtering Supply does not edit operational records. Update supplier settings in Suppliers, orders in Purchase, and receipts in Deliveries.
Troubleshooting
- Supply is missing: confirm the selected webshop, then ask your administrator or Optiply support to check access and report availability.
- The report does not finish loading: reload Supply once and wait for it to finish loading.
- A supplier or chart has no results: check the selected supplier and the relevant section's period and metric. Clear any active supplier filters, try a wider period, and confirm the supplier and its order or delivery history exist in the appropriate operational page.
- A figure is unexpected: check the supplier, metric, unit, period, grouping, legend and any comparison label. Allow for the daily refresh before comparing with operational data; do not infer a cause from an example image.
- The chart unit does not match the selected measure: do not use the chart to draw a conclusion. Contact Optiply support with the selected measure and displayed unit.
If the issue remains, contact Optiply support with the webshop, supplier, report, affected card, chart or column, active settings and what you expected to see. Do not send credentials or secret access links.