

Purpose
Understand the baseline comparison, read the reported value measures and check the context before sharing a result.
Before you start
You need access to Analytics, the Value report must be available for the selected webshop, and the webshop must have a comparison baseline with start and end dates. See Get started with Analytics for report access and navigation.
The baseline is the reference period used for the comparison. The report compares results after that period with an expectation based on the baseline. Confirm the agreed baseline before using the report in a business review.
Value is a modelled comparison, not an audited financial statement, proof that Optiply caused a change, or a guarantee of realised savings. Revenue is not the same as profit, and a reported inventory saving should not automatically be treated as cash released.
Steps: open Value
- Select the webshop you want to review.
- Open Analytics from the main navigation.
- Select Value from the report menu.
- Wait for the report to finish loading.
Check the reporting period and baseline
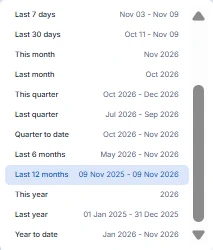
- Check the reporting-period selector at the top, such as Last 12 months. Open it to choose an available preset or Custom range.
- Check the displayed Baseline start and Baseline end dates separately. The reporting period and baseline period are not the same setting; do not treat the date-range selector as a baseline editor.
- Before comparing charts, check their grouping control, such as Week. Grouping is the time interval used to display chart results, not the baseline period.
The date-menu example shows Last 12 months selected. Its dates illustrate that example only; they are not a required reporting range.
Read the revenue comparison
Read these cards together:
- Expected revenue with baseline: the expected revenue used for the baseline comparison.
- Revenue after baseline: the revenue reported after the baseline, for the selected period.
- Extra revenue: the reported revenue difference attributed by the model.
Check the amount and any vs Previous period label separately. The previous-period comparison is not another name for the baseline.
Read the inventory comparison
Read Expected inventory with baseline, Inventory after baseline and Extra inventory savings together. The expected and after-baseline cards provide comparison context; the savings card reports the model's inventory-saving difference.
Do not assume that subtracting the two visible inventory cards reproduces the savings amount. Check the metric definitions below and ask Optiply support if you need an explanation of a result.
Review the overall value and trend
- Read Value from Optiply alongside the revenue and inventory components, rather than as an isolated claim of financial benefit.
- Find the Value metrics chart and check its grouping, axis unit and legend. The example uses Week and a currency axis.
- Compare the available series over time. The example legend uses Extra Net Revenue, Extra Inventory Savings and Value of Optiply; the corresponding revenue and overall-value cards use the shorter labels Extra revenue and Value from Optiply.
- Note when the reported components change and which series is affected. A change in the chart does not establish its cause.
The example below shows negative inventory-saving and overall-value amounts. A coloured comparison indicator does not mean the displayed amount is positive. Read the amount, sign and previous-period comparison separately; do not infer a financial conclusion from a colour or arrow alone.
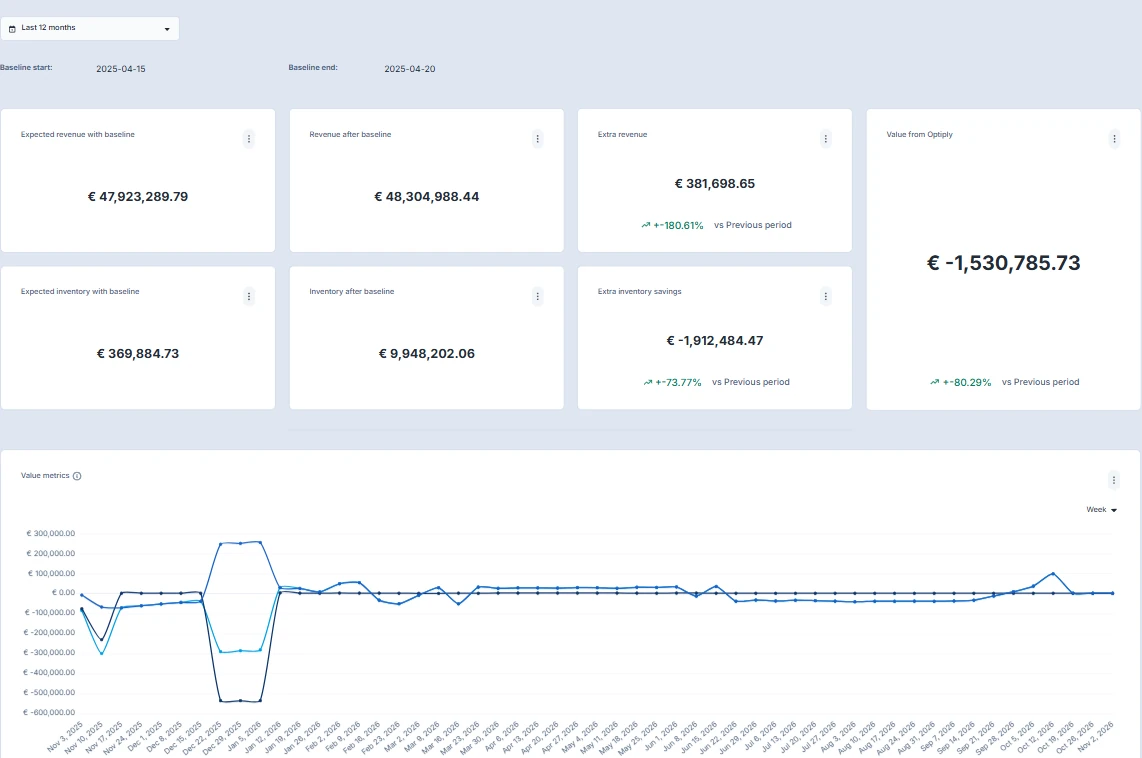
The illustration excludes the chart legend; check the legend in your own report before identifying a series. The inventory comparisons in this example are cards above the chart, not instructions to find separate inventory charts. Your dashboard composition may differ.
Fields
- Baseline Revenue and Baseline Inventory are average values in the baseline data.
- Expected Revenue with Baseline and Expected Inventory with Baseline extend that comparison into the reporting period.
- After Baseline Revenue is summed for the selected period; After Baseline Inventory is averaged. The example cards label them Revenue after baseline and Inventory after baseline.
- Growth is the average percentage change used by the value model.
- Extra Net Revenue is the summed revenue difference attributed by the model.
- Extra Inventory Savings is the summed inventory-saving difference.
- Value of Optiply is the model's overall value measure, shown alongside its revenue and inventory components. The example card is labelled Value from Optiply.
Expected result
You can identify the reporting period, baseline and chart grouping; read the revenue, inventory and overall-value measures; and describe the comparison context before sharing the result. Record the active settings and affected measures rather than sharing a headline figure alone.
Limitations
Results depend on the configured baseline, available historical data and model inputs. Changing the baseline changes the comparison. The report refreshes daily; a new operational change may not appear immediately. The illustrations demonstrate controls and labels, not expected financial results or a universal dashboard layout.
Troubleshooting
- Value is missing: confirm the selected webshop, then ask your administrator or Optiply support to check Analytics access, report availability and whether a comparison baseline is configured.
- The report does not finish loading: reload Value once and wait for it to finish loading.
- A figure looks unexpected: check the reporting period, baseline dates, affected metric, amount sign, previous-period label, chart grouping, legend and unit. Allow for the daily refresh. Do not change the baseline merely to obtain a different result.
- The comparison is unclear: contact Optiply support with the webshop, reporting period, baseline dates, grouping, affected card or chart and what you expected to see. Do not send credentials or secret access links.