

Purpose
Review your configured charts, understand their settings and explore the dashboard-editing controls available to you. You do not need to edit the dashboard to read its charts.
Before you start
You need access to Analytics, and Custom must be available for the selected webshop. To use Edit dashboard or Add a chart, you also need permission to edit that dashboard.
If Custom is missing or does not load, confirm the selected webshop and ask your administrator, Customer Success Manager or Optiply support to check dashboard access and availability.
Steps
Review your dashboard
- Select the webshop you want to review.
- Open Analytics → Custom, if available, and wait for the configured charts to load.
- Check each chart's title, metric, period, grouping, unit and active filters using the explanations below.
- Before comparing values, check that the charts use compatible settings and calculations. Similar chart names do not necessarily mean the values are directly comparable.
Reviewing or filtering a chart does not change operational product, supplier, purchase or delivery records.
Explore the dashboard-editing controls
If you have editing permission, select Edit dashboard where that control is available. The example below shows the dashboard already in edit mode, with Add a chart and Done visible.
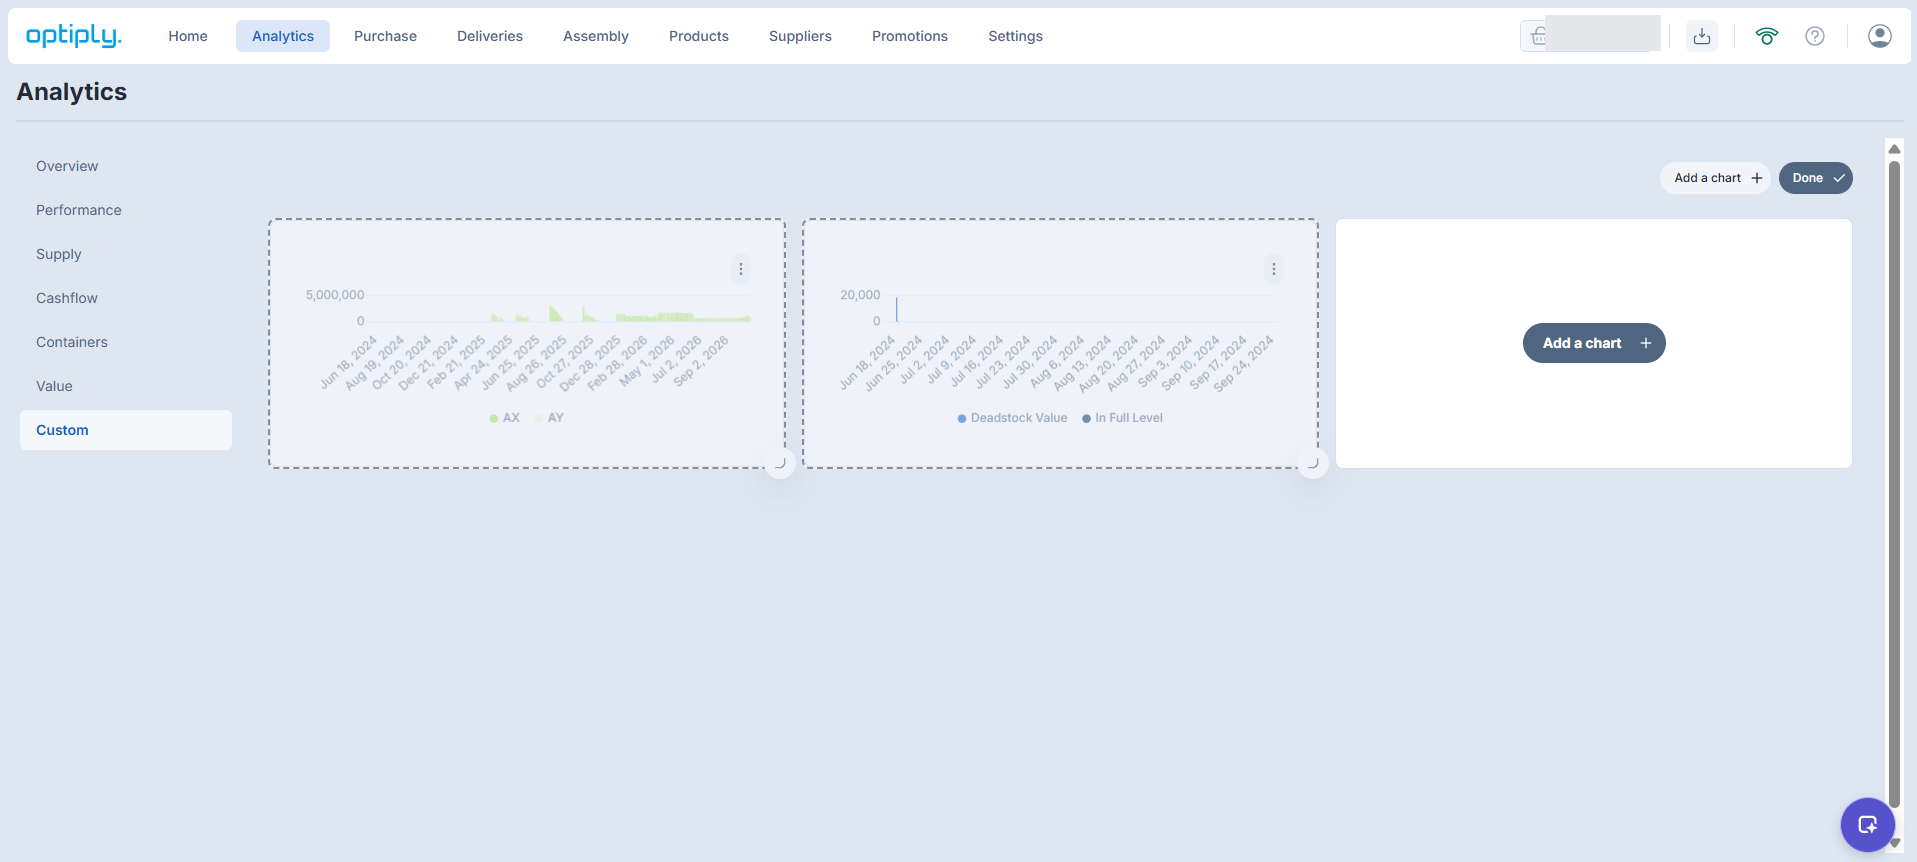
- Add a chart: begins adding a dashboard item.
- Done: the visible control for finishing editing.
This is an example layout, not a recommended set of charts or a standard layout for every webshop. Check each chart's units and calculation before comparing its series.
Explore templates
A template is a starting point for a chart or dashboard control. The example Select a template picker includes bar charts, KPI number cards, date-range controls and a supplier selector. Available templates can vary.
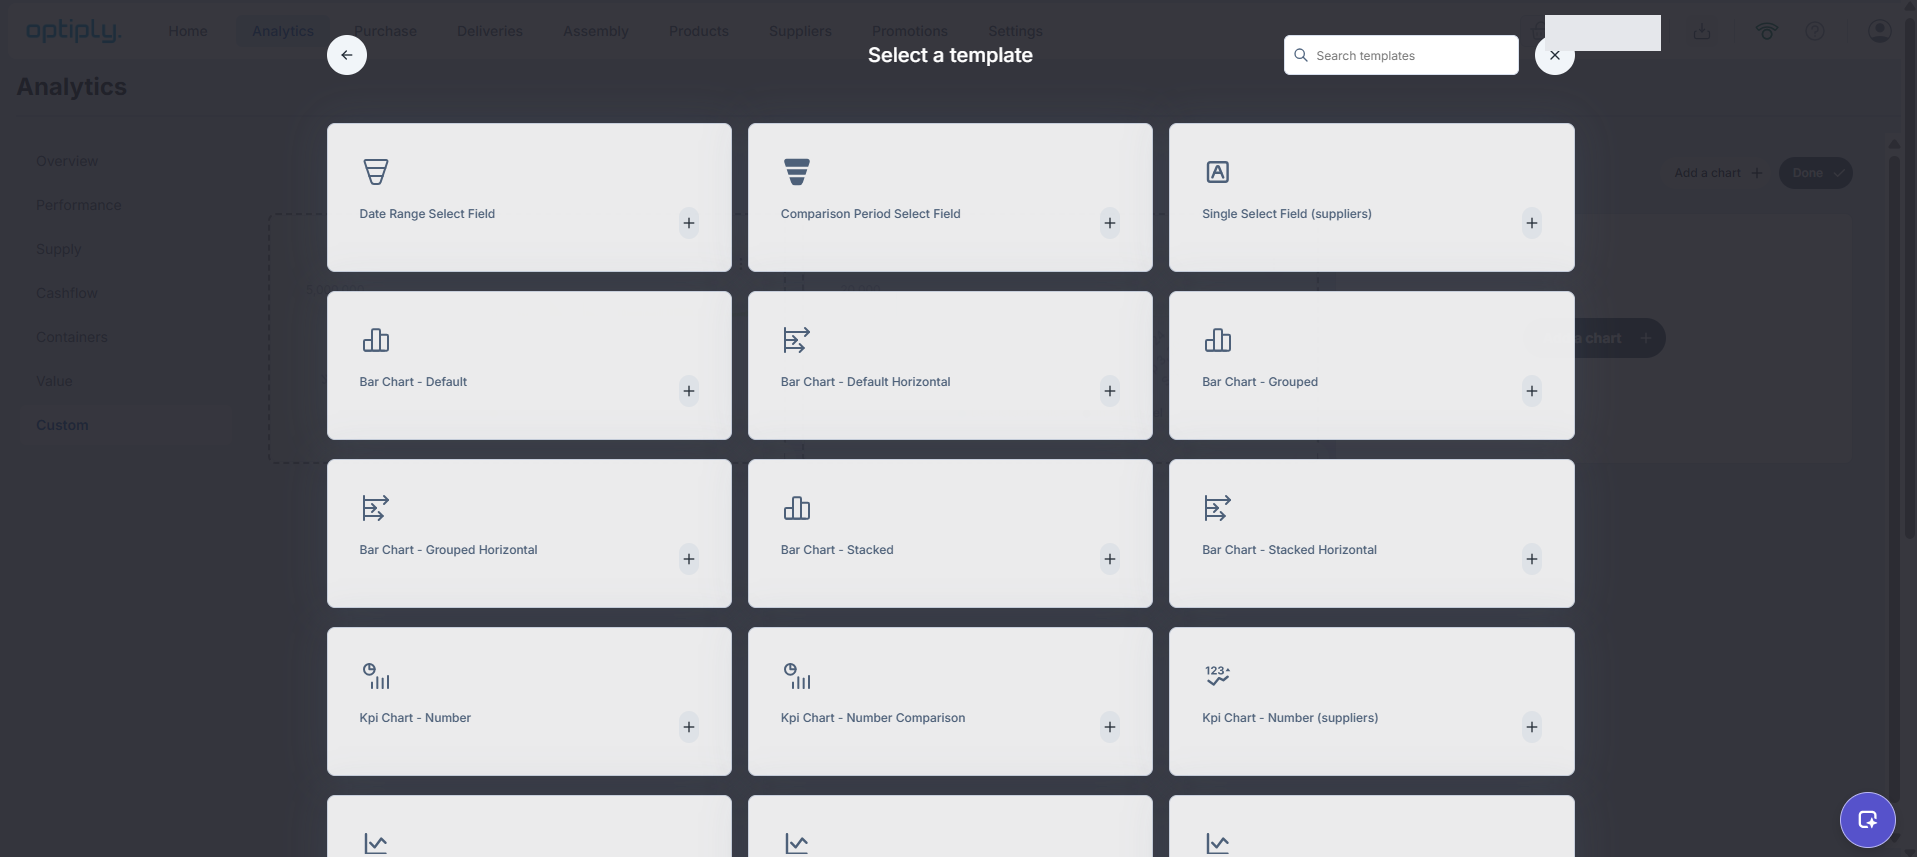
- Search templates: helps you locate a template.
- + on a template card: selects that template.
- Select a template: is the picker title, not confirmation that a chart has been configured.
These examples illustrate the editing controls and template selection, not a complete chart-configuration or saving procedure. They do not show a saved result.
Fields and units
Before using a chart to make a decision, check:
- Period: which dates does it cover?
- Grouping: are results shown by day, month, product or supplier?
- Metric: what is being measured?
- Unit: is the value a percentage, currency amount, quantity or duration?
- Calculation: does it show a total or an average?
- Filters: which records are included?
Custom charts can use available Analytics measures, including:
- Percentages: service level, desired service level, on-time, in-full and placed-from-advice measures.
- Currency values: inventory value, revenue, spend, unrealized-sales value, deadstock value, overstock value and other value measures. Check the visible unit on each configured chart.
- Days: turnover time, supply-chain length, lead time, reorder period and forecast cycle.
- Counts and quantities: units, order lines, product counts and container counts.
- Volume and weight: cubic metres and kilograms.
- Grouping or filtering fields, where available: webshop, supplier, product, category, date, simulation run and container.
Use the chart title, metric, settings and visible unit together to interpret the visual. A daily average and a monthly total describe different comparisons, even when their chart names are similar.
Expected result
Custom loads the dashboard associated with the selected webshop. You can review its configured charts and identify the editing controls available to you. Dashboard editing changes its arrangement or configured charts, rather than operational product, supplier, purchase or delivery data.
Limitations
Custom is configurable, so screenshots or instructions from another webshop may show different charts. Available measures, edit controls and chart types depend on the dashboard configuration and permissions. Analytics refreshes daily; simulation-based charts use the latest available simulation data.
The Custom report in the Analytics sidebar is different from a Custom date-range option inside another report.
Do not assume two charts have the same definition just because their names are similar. Check their metric, period, grouping, calculation and unit.
Errors and recovery
- Confirm the intended webshop and Custom report are selected.
- If the report is missing or blank, ask your administrator, Customer Success Manager or support to check dashboard access and availability.
- When reviewing a chart, clear its filters and reload the tab if it does not load as expected. This is a viewing recovery step, not guidance for saving edits.
- If Edit dashboard or Add a chart is missing, ask your administrator or support to check dashboard-edit permission and the dashboard configuration.
- If a configured chart still does not load, contact Optiply support with the webshop, chart title, active filters and expected result. Do not send credentials or secret access links.