

Purpose
Review stock, revenue and service-level trends for your selected webshop, then compare results across product categories.
Before you start
You need access to Analytics, and Overview must be available for the selected webshop. The report uses the webshop currency. Check the period, grouping, selected measures and comparison labels before interpreting a value.
If Overview is missing, confirm the selected webshop and ask your administrator, Customer Success Manager or Optiply support to check report access and availability.
Steps
- Select the webshop you want to review.
- Open Analytics → Overview and wait for the report to load.
- Read the headline cards and their comparison labels.
- In Overview Metrics (Totals), choose a date range and review the selected measures on each chart.
- Check the time grouping, such as Day, and the units before comparing the plotted lines.
- In Overview Metrics (Categories), review the period and selected measure, then use the legend to identify the product profiles.
- Before recording or comparing results, confirm that the webshop, metric, period, grouping and calculation are appropriate for your comparison.
Start with the headline cards
The example below shows Inventory position, Deadstock value, Revenue and Lost revenue. Treat it as an example of the displayed dashboard, not a guarantee of the same card layout for every webshop.
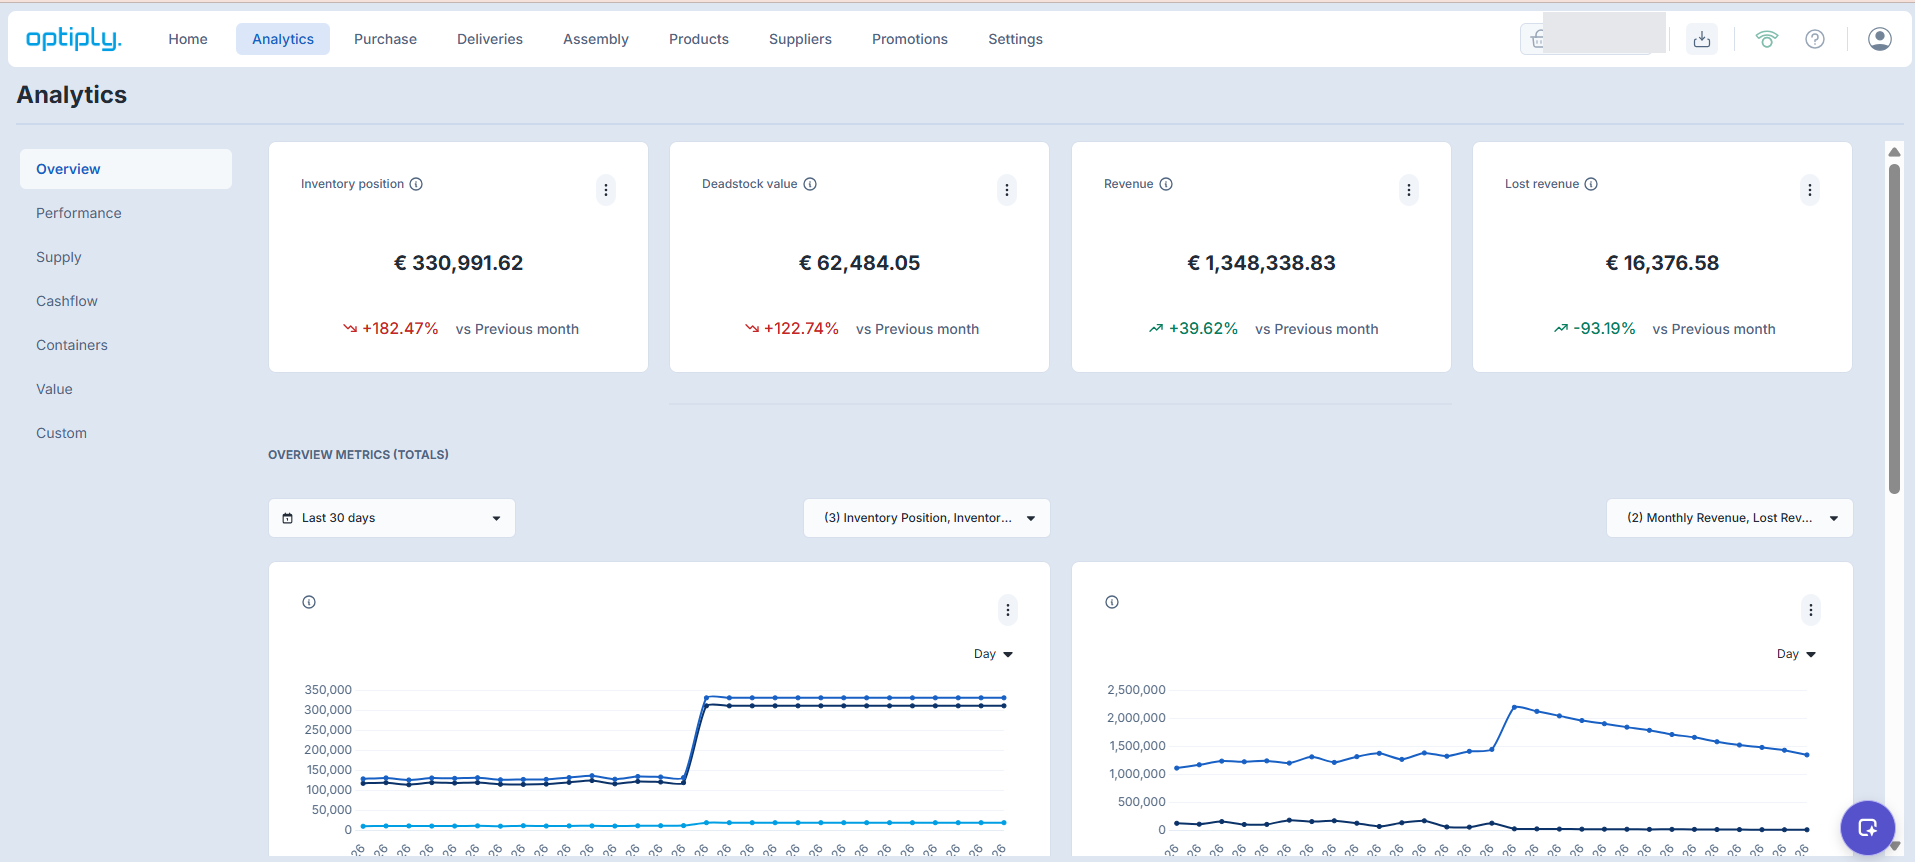
Read each value together with its comparison label, such as vs Previous month. A positive percentage is not automatically an improvement, and a negative percentage is not automatically a problem: consider what the metric measures.
Choose the date range and grouping
The date-range menu offers periods such as Yesterday, Last 7 days, Last 30 days and Custom. Check the dates shown alongside your selection.
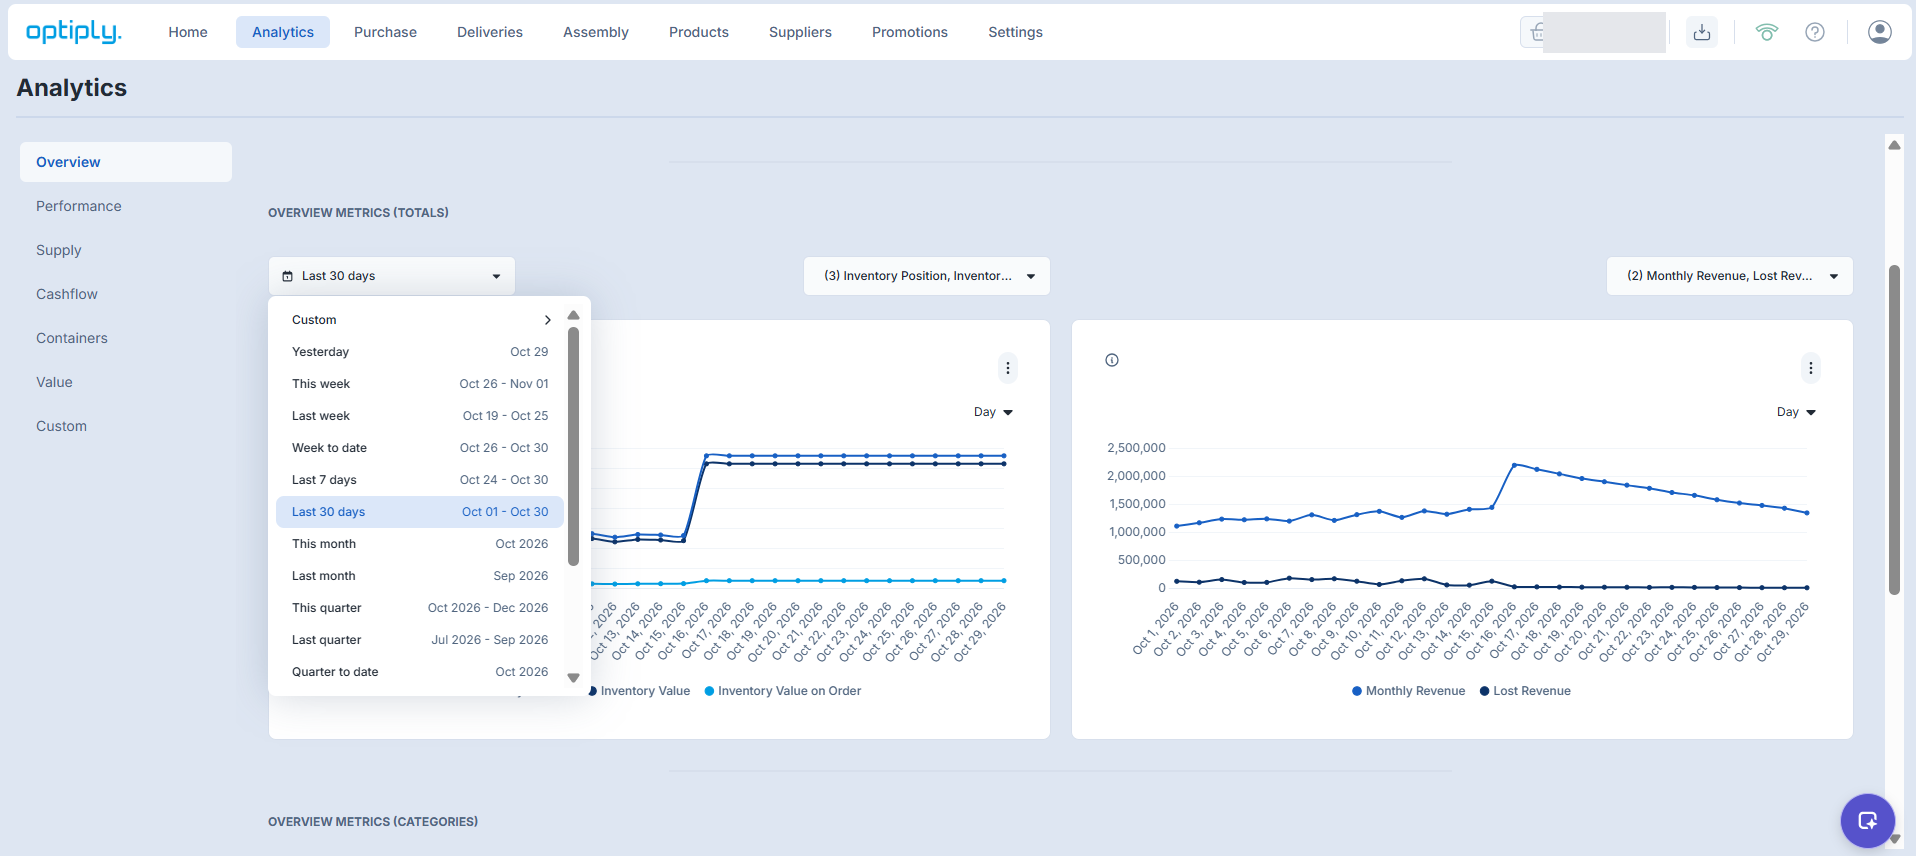
Keep these controls distinct:
- Date range: the dates being reviewed in the relevant chart section.
- Grouping, such as Day: how results are grouped along a chart's time axis.
- Comparison label, such as vs Previous month: the comparison stated on a headline card.
Do not assume that selecting a chart date range also changes the cards' comparison period. Check the labels on the results you are using.
Select and compare chart measures
Use a chart's metric selector to review the available measures. Use the search field to locate a measure, select the relevant checkboxes, and use Apply to apply your selection.
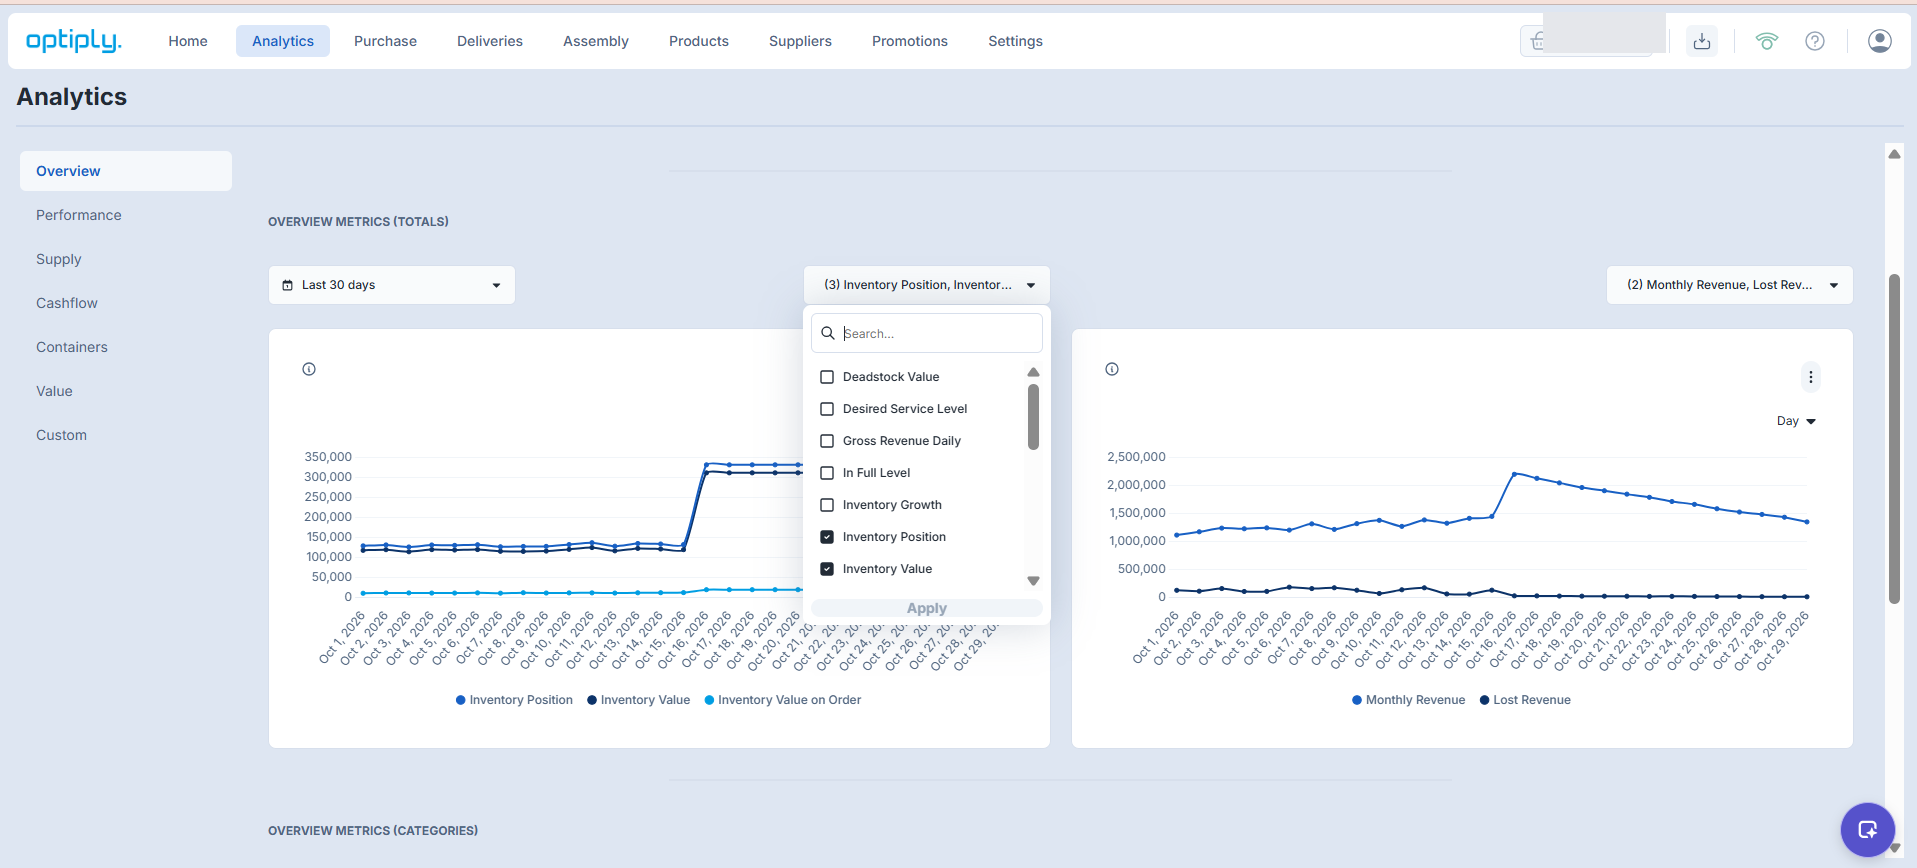
The example inventory chart compares Inventory Position, Inventory Value and Inventory Value on Order. These are related measures, not three names for the same value. The adjacent chart shows Monthly Revenue and Lost Revenue.
Check each measure's definition and unit. A line that appears close to zero may simply be small relative to the chart's scale; inspect the value before drawing a conclusion.
Compare product categories
The example category charts show Desired Service Level and Service Level, with percentage scales and category series AX through CZ.
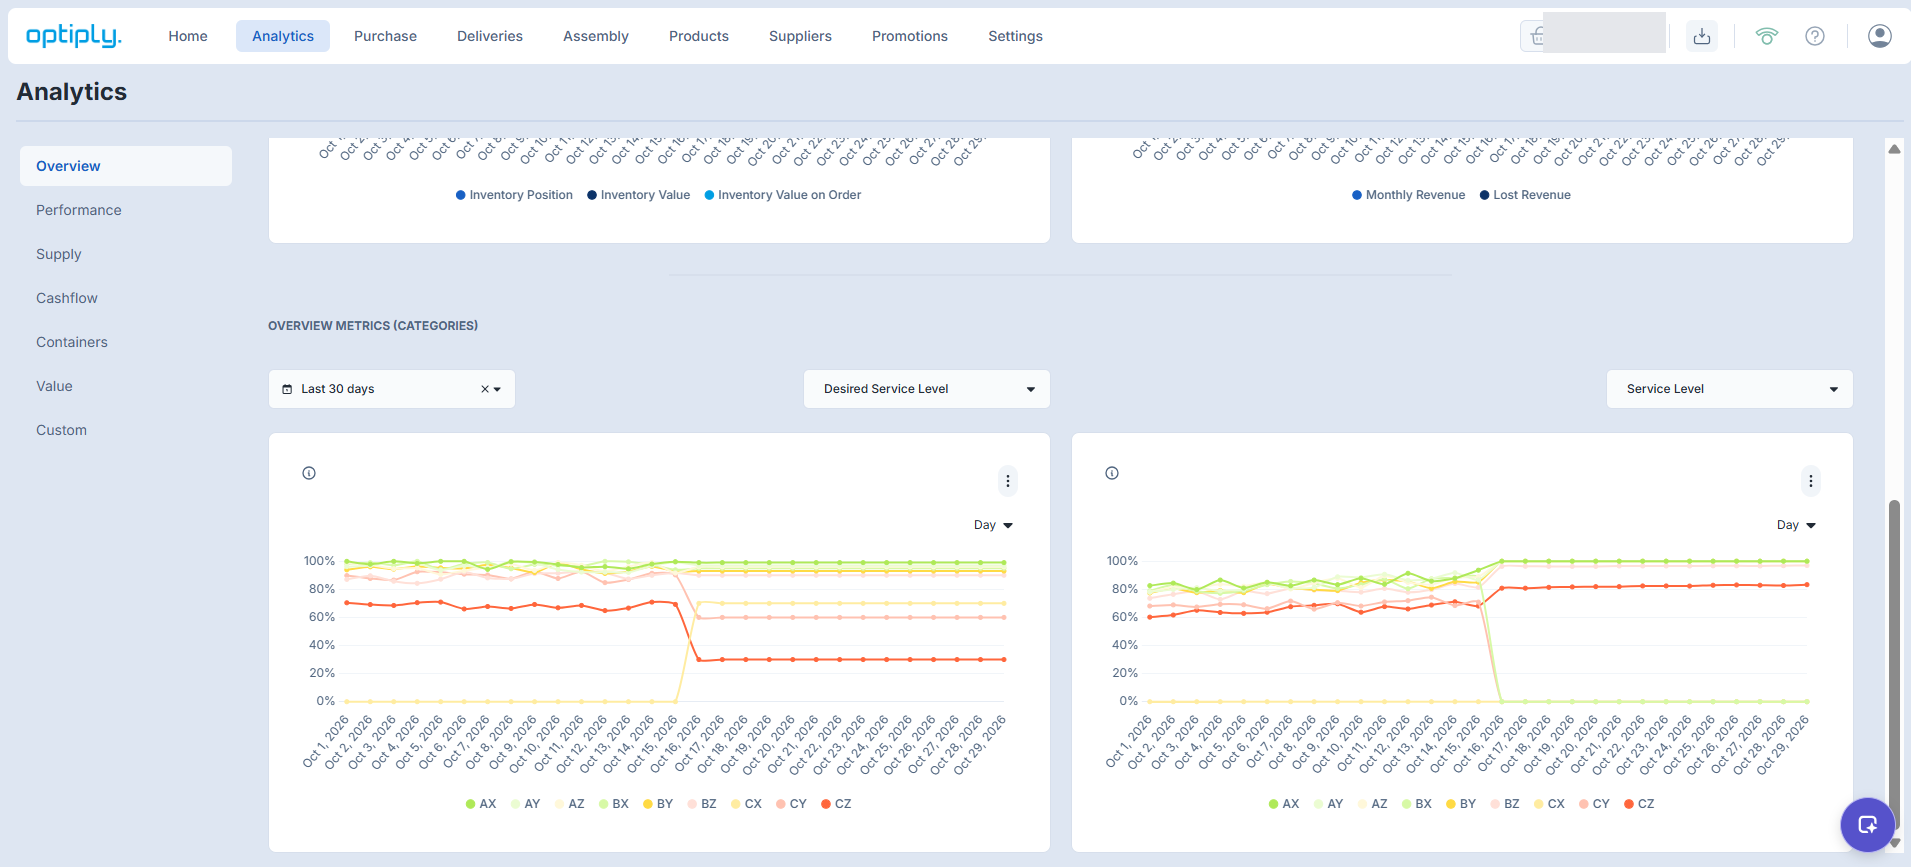
Compare the desired and measured service level for the same category and period. Use the legend to identify each series. AX–CZ combine the ABC and XYZ classifications; see ABC and XYZ classification settings.
A sudden change or a visible zero does not explain its cause. Check the selected measure, dates and data before treating it as an operational problem.
Fields and units
- Inventory Value: the inventory-value measure, averaged across the selected period and shown in the webshop currency.
- Inventory Value on Order: the value of inventory on order, averaged across the selected period and shown in the webshop currency.
- Inventory Position: inventory value plus inventory value on order, averaged across the selected period. It is not the same as inventory value alone.
- Deadstock value: a currency-value measure for stock classified as deadstock. Do not assume a fixed no-sales period from the label alone.
- Desired Service Level: the service-level target, shown as a percentage.
- Service Level: the average modelled stock-availability percentage for the selected period.
- Lost Revenue: an estimate of monthly revenue affected by the service-level gap. It is not a recorded sales transaction.
- Monthly Revenue and Yearly Revenue, where available: average revenue measures from the records in the selected period. Grouping Monthly Revenue by Day does not turn it into daily sales.
- Daily revenue measures, where selected: daily revenue values summed for the selected period or time group. Do not assume every chart labeled Revenue uses this calculation.
- Number of Products, where available: the average product count in the selected period's records.
For a card labeled Revenue, check the metric information rather than assuming that it equals Monthly Revenue or total sales within the selected chart dates.
Expected result
You can identify the selected webshop and the settings behind the displayed values, review the selected totals measures over time, and compare the same measure across product profiles. Recheck the displayed labels and settings after changing a selection.
Limitations
Analytics refreshes daily, so recent changes may not appear immediately. Most stock, service and product-count measures are averaged across the selected period; daily revenue measures are summed. Values can therefore differ from a current operational screen.
The example screenshots show one dashboard layout. Available cards, measures and controls can differ. Chart grouping does not change what the selected metric represents, and the headline-card comparison label must be read separately from chart date controls.
Overview supports analysis. Viewing or filtering it does not change stock, purchasing or delivery records. Make operational changes in the module that owns those records.
Errors and recovery
- Report missing: confirm the webshop and ask your administrator, Customer Success Manager or support to check Analytics access and report availability.
- Chart empty: check the section's date range and the chart's selected measures. Apply any metric selection, then reload the tab and wait for the report to load if needed.
- Value unexpected: check the metric definition, unit, grouping, date range and comparison label. Remember that a period average can differ from a current operational value.
- Still unresolved: contact Optiply support with the webshop, report, exact metric name, active period, grouping, selected measures, comparison label and expected result. Do not send credentials or secret access links.