

Find your forecast
In product details
Open Products, choose the product you want to review and look on its Product tab for Expected demand … (30-Day forecast). For more about the product view, see Products and product details.

In a purchase order
When reviewing an order on Purchase, look for the Last 30-Day demand and 30-Day forecast columns where available. They are separate measures: do not use past demand and the forward-looking forecast interchangeably. The product overview can also show a 30-Day forecast column; the available columns and layout can differ between views.

On the Forecast tab
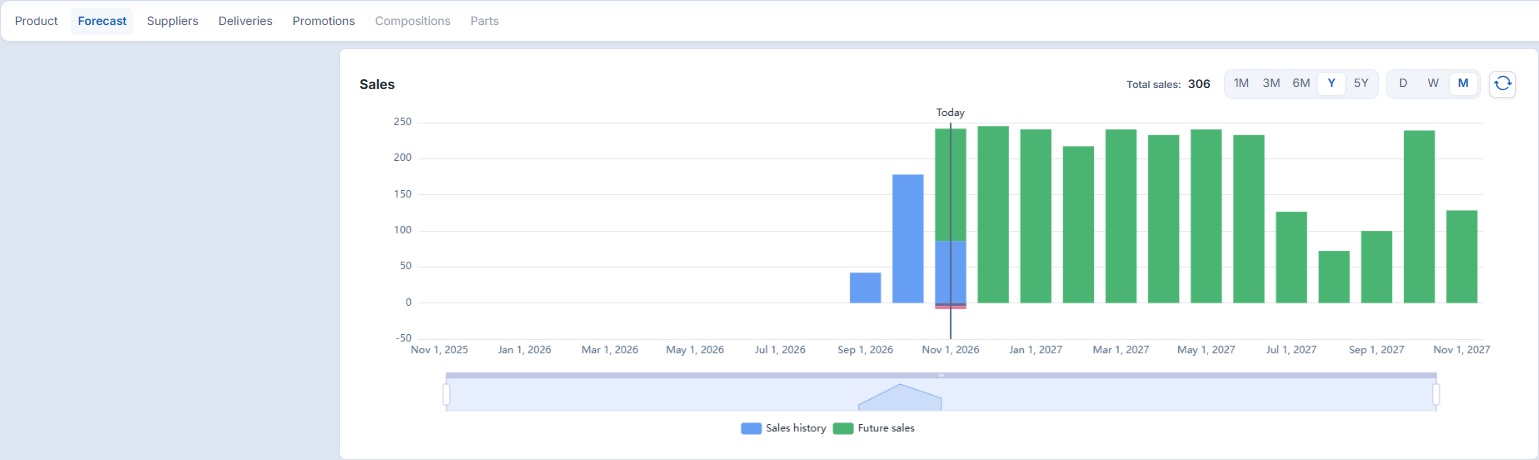
In product details, open Forecast to explore sales history and forward-looking data. The example Sales chart below shows Sales history and Future sales over a longer range. Its individual bars and Total sales are not identified here as the product's 30-day forecast total. Check the selected period and grouping before comparing values.
Forecast versus purchase advice
Forecast is a demand estimate, not a purchase quantity. Purchase advice also considers the planning period, Safety/Buffer stock, Stock position, Lead time and Reorder period, MOQ, Lot Size, MOV and other supplier constraints, product and supplier state, and manual stock constraints.
Forecasts can differ between products because of their available sales history, stockouts, settings, seasonality, promotions, unusual demand and the forecasting approach applicable to that product. A new product's advice can be provisional when history is limited. Changes may appear after the relevant data update or planning process has completed; an immediate or universal overnight update is not guaranteed.
Use Product stock-history graph filters
Purpose
Review historical stock and forward-looking stock information for a chosen interval. Changing the graph view does not change the forecast or purchase advice.
Prerequisites
- Open the correct product's Forecast or stock-history view.
- Check the selected webshop and product.
- Wait for graph data to finish loading. Available history and controls depend on the view and product data.
Steps
- Choose the available period or forecast horizon for the stock-history graph.
- Choose an available grouping and check the dates shown on the graph.
- Review the historical stock and forecast data, alongside sales and stockout context where shown.
- Change one control at a time when comparing views. Align the periods before comparing a graph with another forecast value.
- Note the product and selected period before making a separate planning decision. Use Refresh, where available, to request current graph data—not to recalculate the forecast or save settings.
Fields and columns
- Period, horizon and grouping — the graph interval and presentation. They are viewing controls, not editable stock records.
- Forecast, sales, stock history and stockouts — the product context available for the selected view. Missing values do not prove zero demand or zero stock.
- Stock forecast (without backorders) — when available, a dashed grey comparison line alongside the normal forecast. Viewing it does not change purchase advice. Its absence does not prove there are no backorders. The overdue marker uses the normal forecast, not this comparison; the label alone does not explain how backorders are calculated.
Expected result
The graph reloads with the available product data for your selected period and grouping. Historical stock may remain visible even if forecast loading fails.
Limitations
With an active supplier, the forward-looking horizon depends on the product's order cycle and delivery-time inputs, within the limits of the applicable view. Do not assume every graph uses a fixed 30-day horizon.
In the product-detail view that supports this behavior, Sales and Product stock-history graphs can start loading after supply-chain information has finished loading even when the product has no active supplier. They use a 30-day fallback for forward-looking data. This is not confirmation that every account or graph view has the same behavior.
The fallback does not guarantee that data is available. It does not change the forecast calculation or purchase advice, limit retained history to 30 days, or describe the graph's initial zoom. With an active supplier, do not substitute 30 days for the applicable order-cycle and delivery-time inputs.
Errors and recovery
- Loading or blank graph: check the product, webshop and selected period, and wait for loading to finish. A loading placeholder is not proof that data is missing. Follow Product graph loading checks if needed.
- No data: No data is available for the selected time frame means there is no matching display data for that selection—not necessarily zero demand or stock.
- Error: if Could not load stock history due to an error appears, use the available Refresh action after loading finishes. Refresh requests data; it does not guarantee a repair or upstream recalculation.
- Unexpected value: review sales history, stockout periods, product status, promotion dates and rules, supplier timing and current algorithm settings. If it remains unexplained, contact Optiply Support with the product, selected view, period and visible error. Do not send credentials.